By Danielle Kaschube, MAPS Program Coordinator, The Institute for Bird Populations
The Monitoring Avian Productivity and Survivorship (MAPS) program, coordinated by The Institute for Bird Populations (IBP), is a continent-wide collaborative effort among public agencies, non-governmental groups, and individuals to assist the conservation of birds and their habitats through bird banding. MAPS bird banders collect data that can be used to estimate key demographic parameters such as productivity, recruitment, and survival of individual bird species. This information helps scientists understand which life-stages may be most important in limiting population growth or causing declines. Since 1989, more than 1,200 MAPS stations have operated in nearly every US state and Canadian province.
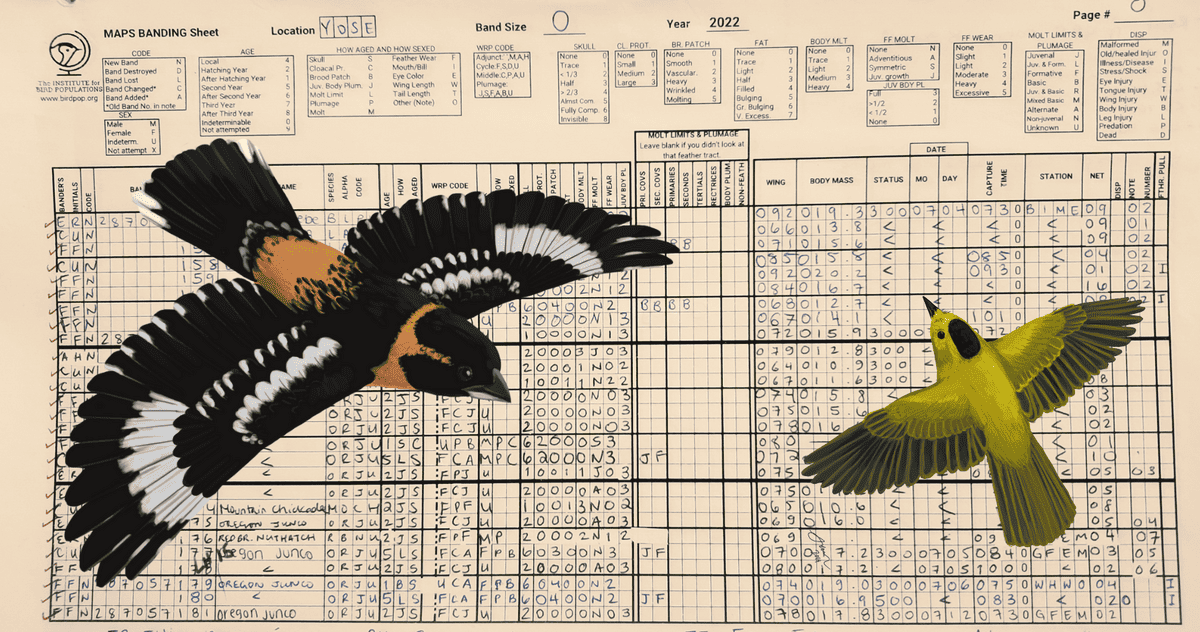
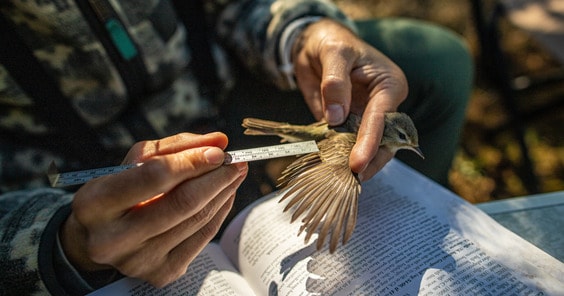
MAPS monitoring stations follow a standardized, constant-effort bird banding protocol so that data from different stations or years can be compared. Stations are operated by scientists, land managers, and banders working independently, or with diverse organizations including public agencies, universities, and NGOs; sometimes they are even operated directly by IBP under contract. MAPS operators collect information on the age, sex, body condition, and reproductive status of hundreds of species. Subsequent recapture data provide information on survival, reproductive rates, recruitment, and movement patterns.
Data collected by MAPS banders is submitted to IBP where it undergoes a rigorous proofing process before it is added to the MAPS database. The database is a unique and valuable scientific resource consisting of over 2 million bird capture records spanning 33 years and counting. To date over 280 peer-reviewed research papers and reports using MAPS data have been published by IBP scientists and outside researchers.
IBP wanted to make it easier for researchers to use the data and for everyone to understand how bird populations are faring. To that end we created the MAPS Data Exploration Tool, a new web application designed to make the MAPS database more accessible and the MAPS program more impactful. The web app houses two tools developed by IBP: a data download tool and a results exploration tool.
The MAPS Data Download tool gives researchers access to over 1,850,000 capture records for the years 1992-2018 (additional years will be added as the data is proofed.) The app interface allows users to select the timespan and type of data they are interested in. Data available includes capture records (band number, age class, mass, wing length, etc. for individual birds), banding station locations, capture effort information, and local breeding status classifications. We hope that this data download toll will encourage more researchers to investigate bird conservation and other ecology questions using MAPS data.
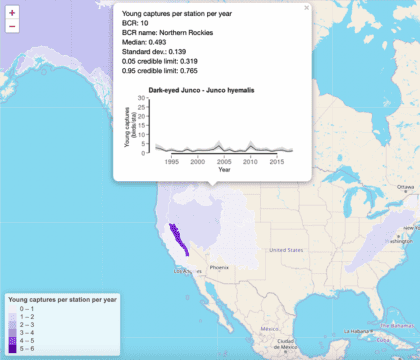
The Explore MAPS Results app serves as an update to the Vital Rates of North American Landbirds published in 2015. Thirteen additional years of data and newer, improved statistical modeling techniques have been used to create region- and year-specific estimates of demographic parameters. The tool includes estimates or indices for 5 demographic parameters: 1) adult abundance, 2) juvenile abundance, 3) productivity, 4) adult apparent survival, and 5) residency probability for dozens of the more commonly captured bird species. Results for more species, regions, and parameters may be added over time. Users can visualize the results on an interactive map, with pop-up graphs for some parameters, or if they prefer to create their own graphs, they can download the results to visualize as they choose.
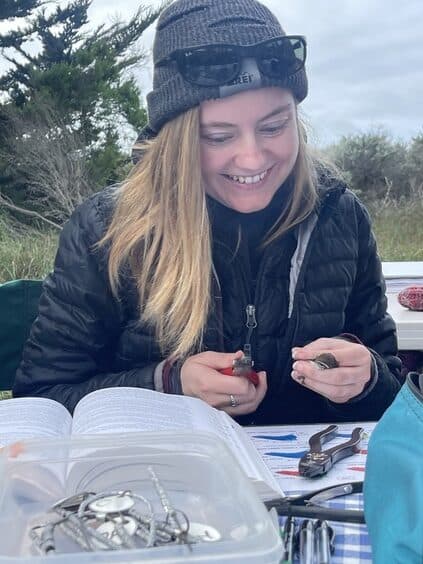
We are so excited for you to dive in and explore the MAPS database with these new tools. The database is an amazing resource for bird conservation, and it would not be possible without the hard work and sacrificed sleep of thousands of MAPS banders over more than three decades. These banders didn’t wake up at zero-dark-thirty just to fill in numbers on a spreadsheet! Dig in and put the data to good use!